"Infographic: graphic visual representation of information, data or knowledge intended to present complex information quickly and clearly." (Wikipedia)

Infographics, or information graphics, such as graphs, charts, tables and maps, can be used by bloggers to enhance their blog. One website claims that if you give an oral presentation, your audience will retain about 10% of what you presented. However, if you include visuals and written words in your presentation, that figure rises dramatically to 50%. To read about the power of visual communication, visit http://www.billiondollargraphics.com/infographics.html.

Infographic courtesy www.millerbusinesscenter.org.
While we think of infographics as a recent phenomenon, they have their roots in the early 19th Century (http://en.wikipedia.org/wiki/Infographic). Back in 1801, Englishman William Playfair, a political economist, published the first area chart and pie chart in his Statistical Previary. In 1857, the famous nurse, Florence Nightingale, used inforgraphics to persuade Queen Victoria to improve military hospital conditions during the Crimean War. In 1861, Charles Minard prepared a complex infographic on Napoleon's disastrous march on Moscow.
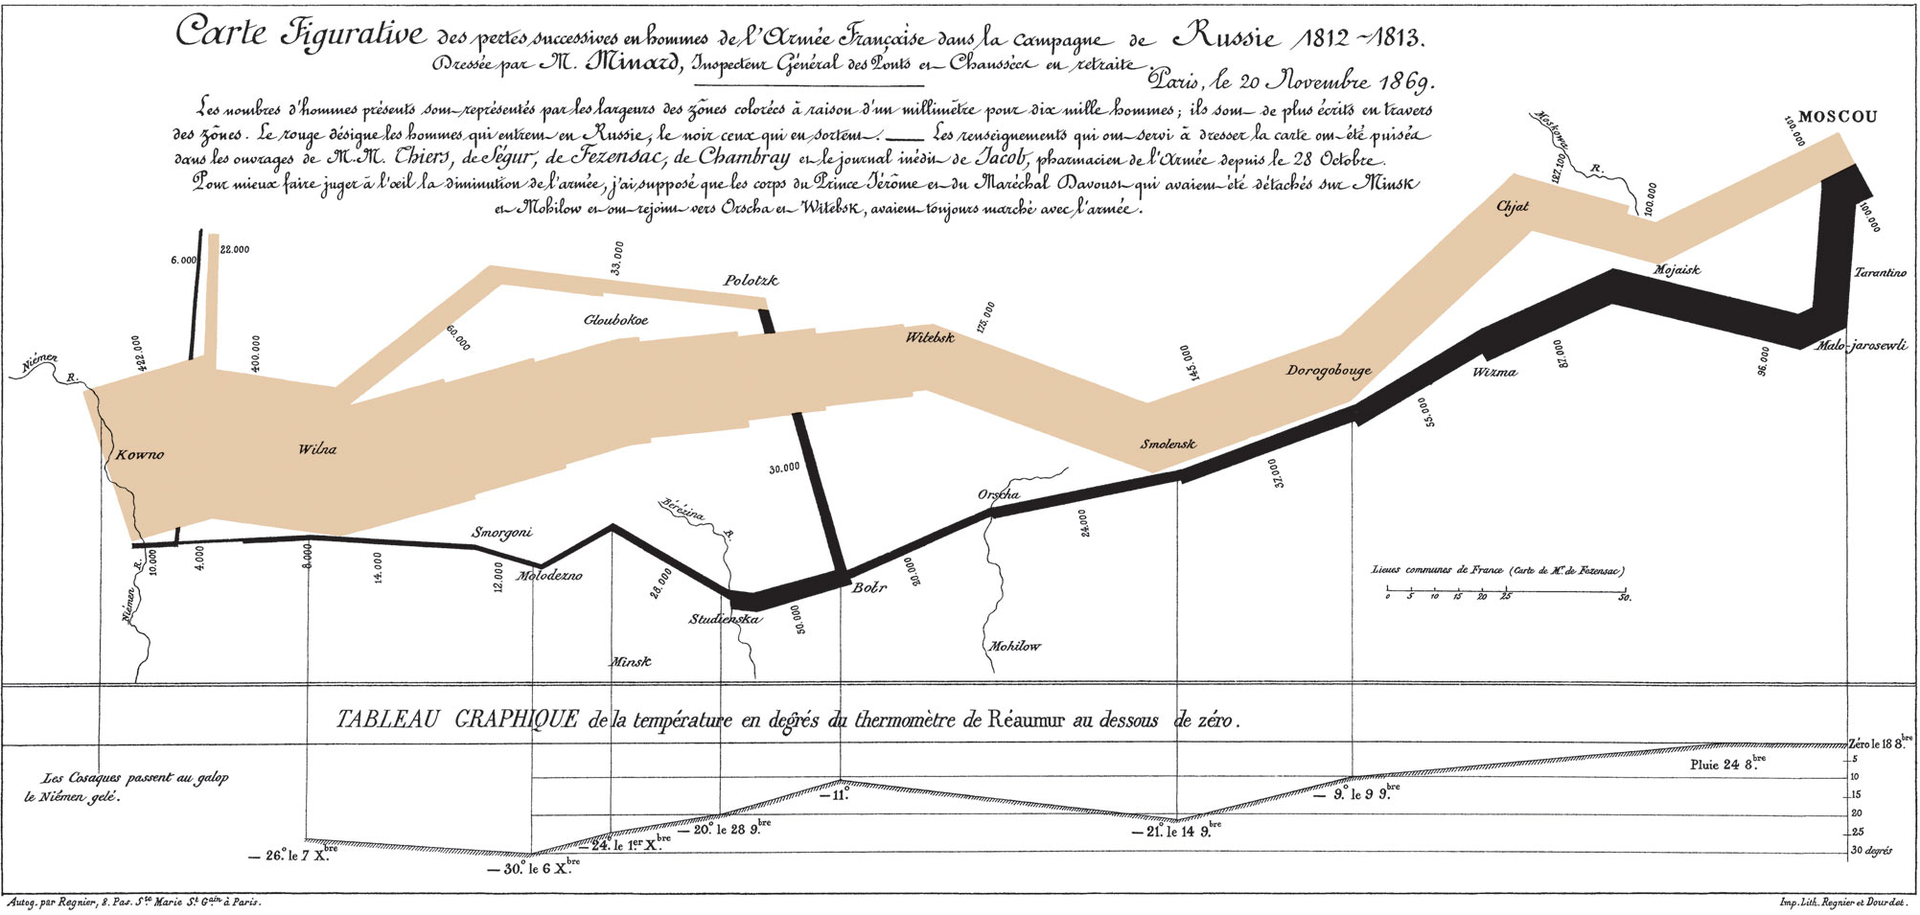
Charles Minard's infographic courtesy en.wikipedia.org.
In 1933, the London Underground was the first to make use of modern maps to sketch out its complicated subway system. In 2010, an infographic illustrated how buildings have grown over the past several decades, starting with the Empire State Building and finishing with a modern marvel in Dubai (Skyscrapers Through History: The World is Getting Taller). Our brains crave infographics as explained by the following infographic http://visual.ly/13-reasons-your-brain-craves-infographics?view=true.

"The World is Getting Taller" infographic courtesy thumbnails-visually.netdna-ssl.com.
Here is a metro Washington subway map which makes good use of infographics.

Facebook, Twitter and Pinterest are litterered with infographics. They not only convey information, but they also advertise your brand and generate more traffic to your blog. Why not add them to your blog posts? For tips about creating effective infographics, visit the following website at https://www.visioncritical.com/pretty-and-pretty-useful-how-create-awesome-infographics/.
Ten infographics on Pinterest at dailyinfographic.com.
Great Information sharing .. I am very happy to read this article .. thanks for giving us go through info.Fantastic nice. I appreciate this post.
ReplyDeleteResearch Paper Writing
ReplyDeleteThis is a great inspiring article.I am pretty much pleased with your work.You can really really helpful information. Keep it up. Keep blogging. Looking to your next post.